Mapped V3
Mapped is a visual mapping tool for organisers. It turns static membership lists into live, shared maps, and lets groups overlay them with the political, demographic and geographic data they need to plan.
Project summary
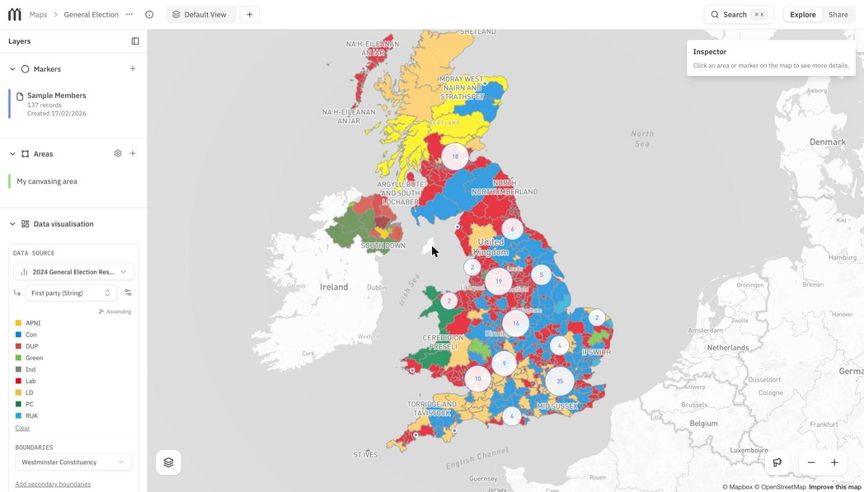
Mapped is Common Knowledge's own product: a platform, free for grassroots organisers, that shows you where your members are and what is going on around them. Connect Action Network, Airtable, Google Sheets, Mailchimp, Baserow or Zetkin, or upload a spreadsheet, and your people appear on a map. From there you can colour constituencies, wards or Census areas by election results or deprivation data, add markers for local groups and targets, draw the turf you're canvassing, and populate your source database with geographical data.
Alongside the private tool, Mapped now publishes public maps, and it serves as the engine behind other organisations' campaign websites.
The version running today is our third. It was rebuilt from the ground up in 2025 by Joaquim and Arbnor from the co-op, after we learned a number of lessons from the version before it.
The wider political context
Organising is grounded in place. Whether it's a tenants' union, a climate campaign or a branch of a trade union, the basic questions are the same: where are our people? Where are we strong, and where do we need to grow? Who lives close enough to turn out for an action, and what decisions do they want to have a say over?
Every level of democratic decision-making in the UK is organised geographically, from councillors to MPs to metro mayors. So are many of the institutions movements try to move, from NHS bodies to local authorities. A group that can show it has hundreds of members in a particular constituency has something real to bargain with.
And yet most movement membership data lives in spreadsheets and CRMs that are static, siloed and opaque. They're good at storing contacts and sending emails. They're bad at answering the questions above. The tools that can answer them, geographic information systems and data pipelines, are expensive and need specialist skills, which leaves most organisers to fall back on Google Maps, sticky notes on a paper map of the UK, or nothing at all.
Why this is important
When we interviewed organisers about how they use maps, every one of them was already mapping in some form, and almost all of them wanted to map things they couldn't. One organiser at POMOC, who organises Polish and Eastern European communities, described wanting to find Eastern European grocery shops in East London, see where their members lived in relation to them, and share that picture with allied groups without exposing anyone's personal data. That's a simple, concrete need, and no affordable tool met it.
Seeing your members on a map, in context, is not a luxury feature for well-resourced campaigns. It's one of the most basic things an organisation needs to plan strategically rather than broadcast and hope. If movements can't see where their power is, they can't build it deliberately, and they can't coordinate with each other to avoid duplicating effort in the same places.
Our strategy
Mapped began in early 2024 as a very small tool: upload a CSV of supporters and get it back enriched with constituencies and other geographic data. It was built through our work with Green New Deal Rising, POMOC and Medact ahead of the 2024 general election, with support from the Joseph Rowntree Reform Trust, and it confirmed that the need was widely shared.
The second version grew that into a full platform: CRM integrations, choropleth maps, area statistics. To move quickly, we built it in Python and Django on top of mySociety's Local Intelligence Hub. That got us a working product fast and generated real excitement in demos. Unfortunately, however, that foundation didn’t hold up. It was slow on large datasets, included far too much code that we didn’t need, and prevented us from making use of modern code-quality tools.
So in early 2025 we made the case internally for starting again. The strategy had two halves:
- Rethink the technology so the tool would be fast with the large datasets real movement organisations hold.
- Simplify the experience around the core need. Our shorthand became "Mapped lets you put things on a map": your members, other markers (a community hall, a target's office, a pub), and turf, the areas you draw yourself. Union regions and campaign patches rarely match official boundaries, so turf matters. More advanced tools like choropleths sit one step further in, so new users aren't buried on day one.
We also kept to a funding model we believe in. Mapped is free for grassroots groups, and it is sustained by grants and by larger organisations commissioning features that then become available to everyone.
Method / process
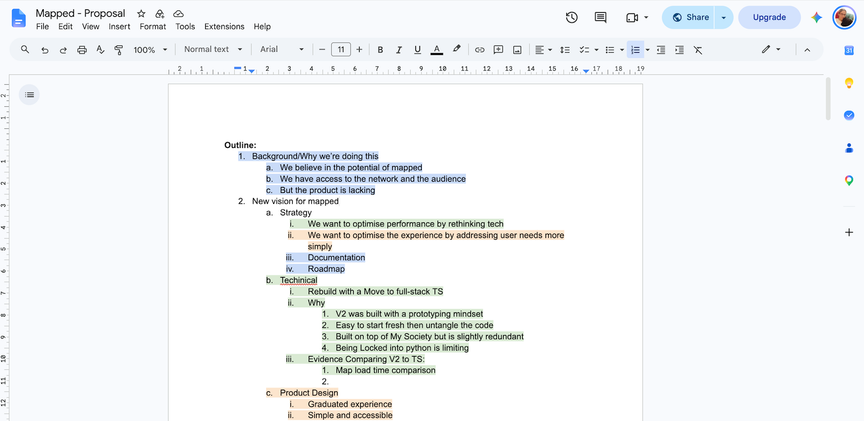
The technical case for the rebuild rested on two decisions in version two that hadn't aged well. Building on Local Intelligence Hub brought a data model that wasn't designed for our use case, and its data had gone out of date anyway, so we were re-importing election results and MP data ourselves. Writing the back end in Python meant fighting an async framework that integrated poorly with Django – profiling showed up to a quarter of request time going on async boilerplate.
We rebuilt Mapped in full-stack TypeScript on Node.js, and for a project like this we think that's clearly the right choice. Mapped's workload is mostly waiting on input and output: querying a geospatial database, calling out to CRMs, streaming large imports. Node's event loop is asynchronous by default, so it handles that kind of work efficiently without layers of extra machinery. Using one language from the database to the browser also means types are shared end to end. If the database schema changes, the compiler immediately shows every part of the code that needs to change with it. We switched on strict type-checking and linting from the first commit, so the codebase was solid from day one. Client, server and background jobs are all defined in a single Next.js project, which keeps hosting cheap and development quick.
Before committing, we tested a bare-bones TypeScript prototype against the old system using Hope Not Hate's Output Area dataset. Even unoptimised, it imported data about twice as fast (around 51,000 records a minute against 26,000), and rendered a choropleth of Output Areas in about 1.5 seconds where version two took 10 or 11.
The rebuild began in March 2025. We worked in short cycles, put early versions in front of organisers, and let real projects shape the roadmap:
- For Hope Not Hate, we built a secure, explorable visualisation of their own custom small-area MRP polling alongside supporter locations, to inform their organising strategy.
- For the AB Charitable Trust, which advises funders on where to direct grants, we made it possible to visualise their own research in the context of different regions of the UK and feed it into their funding strategy.
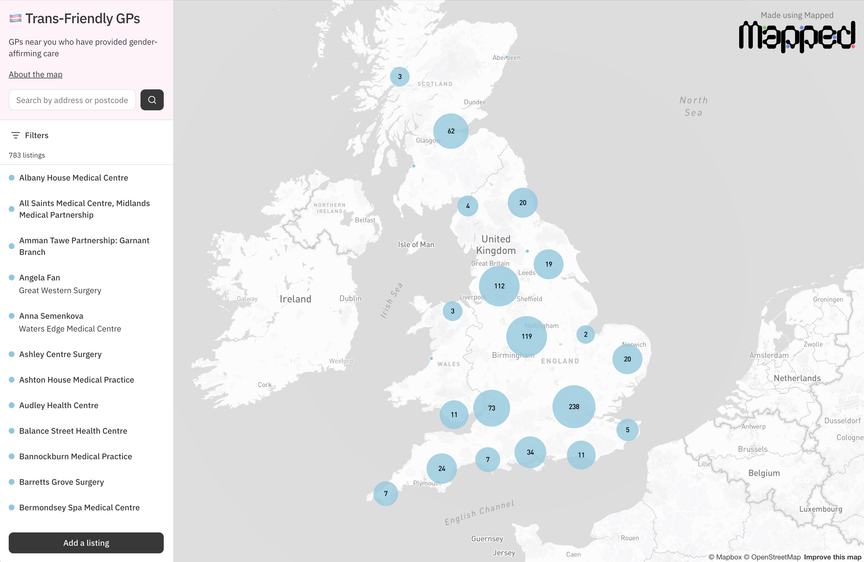
- For the Movement Research Unit, we built the first public maps: a way to publish a map, with its own address, for anyone to explore. The first of these was a crowd-sourced map of trans-friendly GPs.
- Underneath it all, we built a Movement Data Library: shared boundaries and datasets that every organisation can use without hunting them down themselves. It covers Census output areas, Westminster constituencies, wards, councils, Senedd and Holyrood seats, NHS Integrated Care Boards, Church of England dioceses and more.
We relaunched Mapped in October 2025.
Result
The new Mapped is faster, simpler and far easier to maintain. It handles millions of records comfortably (although is still limited to about 10,000 markers per map). It now holds around 5.8 million records across roughly 350 data sources, from small Google Sheets to Action Network lists with tens of thousands of supporters. Users have drawn more than 880 areas of turf on their maps.
Public maps have taken on a life of their own. After the Movement Research Unit's trans-friendly GP map, organisers across the movement began publishing their own: target maps for the Stop Burning Trees coalition and Axe Drax, Stop Rosebank, Bank Better, the Make Polluters Pay UK network, a map of Thames Water storm overflows, and a shared map of spaces for organising in London.
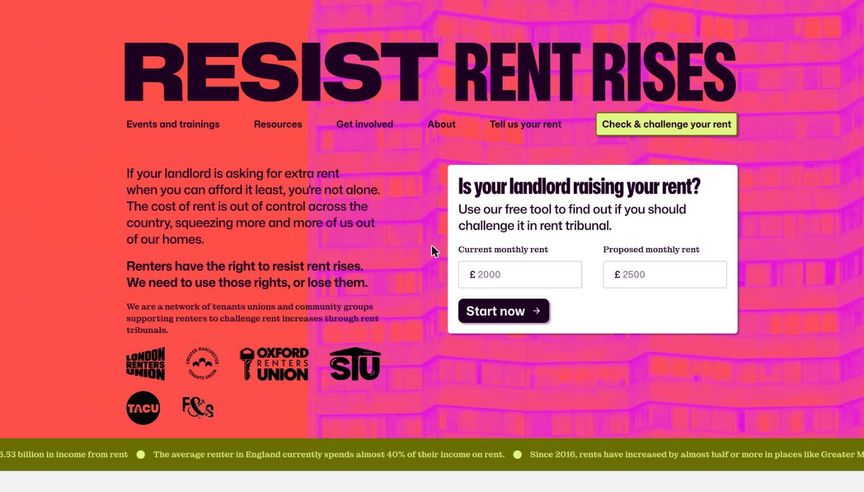
Mapped also now works "headless", as the data and mapping engine behind other people's websites. Three campaigns have used it this way:
- Resist Rent Rises, the tenant union coalition started by London Renters Union, which helps renters challenge rent increases at tribunal.
- Mobilise Everywhere, a crowdfunded map of grassroots activity in towns outside the big cities.
- Green New Deal Rising's My Election Map, which pointed people to places where they could help elect hope and beat the far right in the May 2026 elections. Over 116,000 people used My Election Map to campaign in the May elections, and 75% of My Election Map target seats were won.
Impact
More than a hundred organisations now have accounts on Mapped, from tenant unions and climate groups to migrant solidarity organisations and national campaigns. For many of them, it's the first time they've been able to look at their membership and see it as a map of where their power is, rather than a list of names.
The headless sites show something we didn't fully anticipate when we started: the rebuild made Mapped solid enough to be infrastructure for other people's tools, not only a tool in itself. A coalition can launch a public-facing site in weeks, without building or paying for its own geospatial back end.
We've also learned that software alone isn't enough. Some organisers have run with Mapped in exactly the ways we hoped, using it to guide tactics and strategy, but they're still a minority. That's why we now pair the tool with mapping workshops that help people think like mapmakers, and why the next phase of Mapped focuses on collaboration: making it easier and safer for allied groups to share what they know.
Want to map your movement?
Mapped is free for grassroots organisers. If your group wants to try it, or you'd like to commission a feature that the whole movement could benefit from, get in touch at [email protected].