The Annual Deprivation Index (ADI)
Background
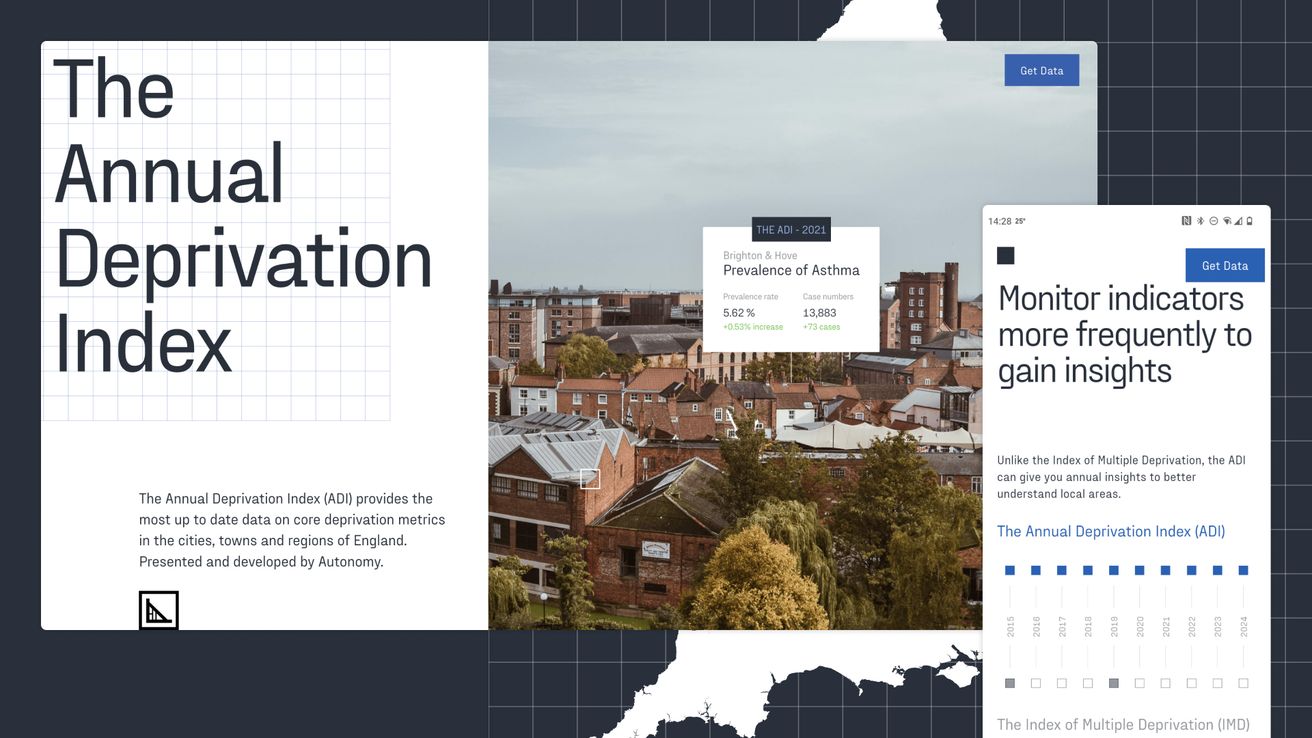
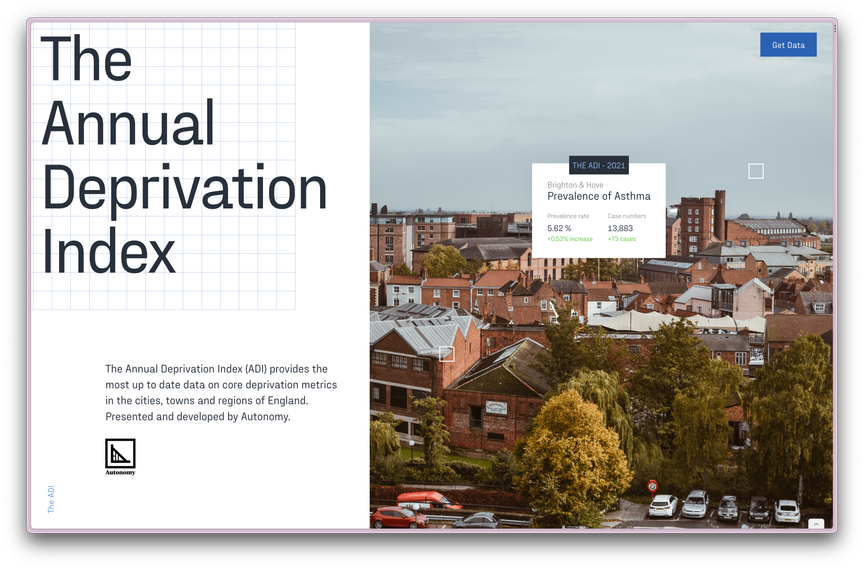
The Annual Deprivation Index (ADI) is a project by the think tank Autonomy.
It provides researchers and local authorities with granular, up-to-date data with which to base their analyses. This provides decision-makers with the information they need to allocate government resources, evaluating policies and understanding socio-economic inequalities.
The Index is constructed using high–frequency indicators of health, employment and crime. These have multiple subdomains relating to different forms of crime and health conditions.
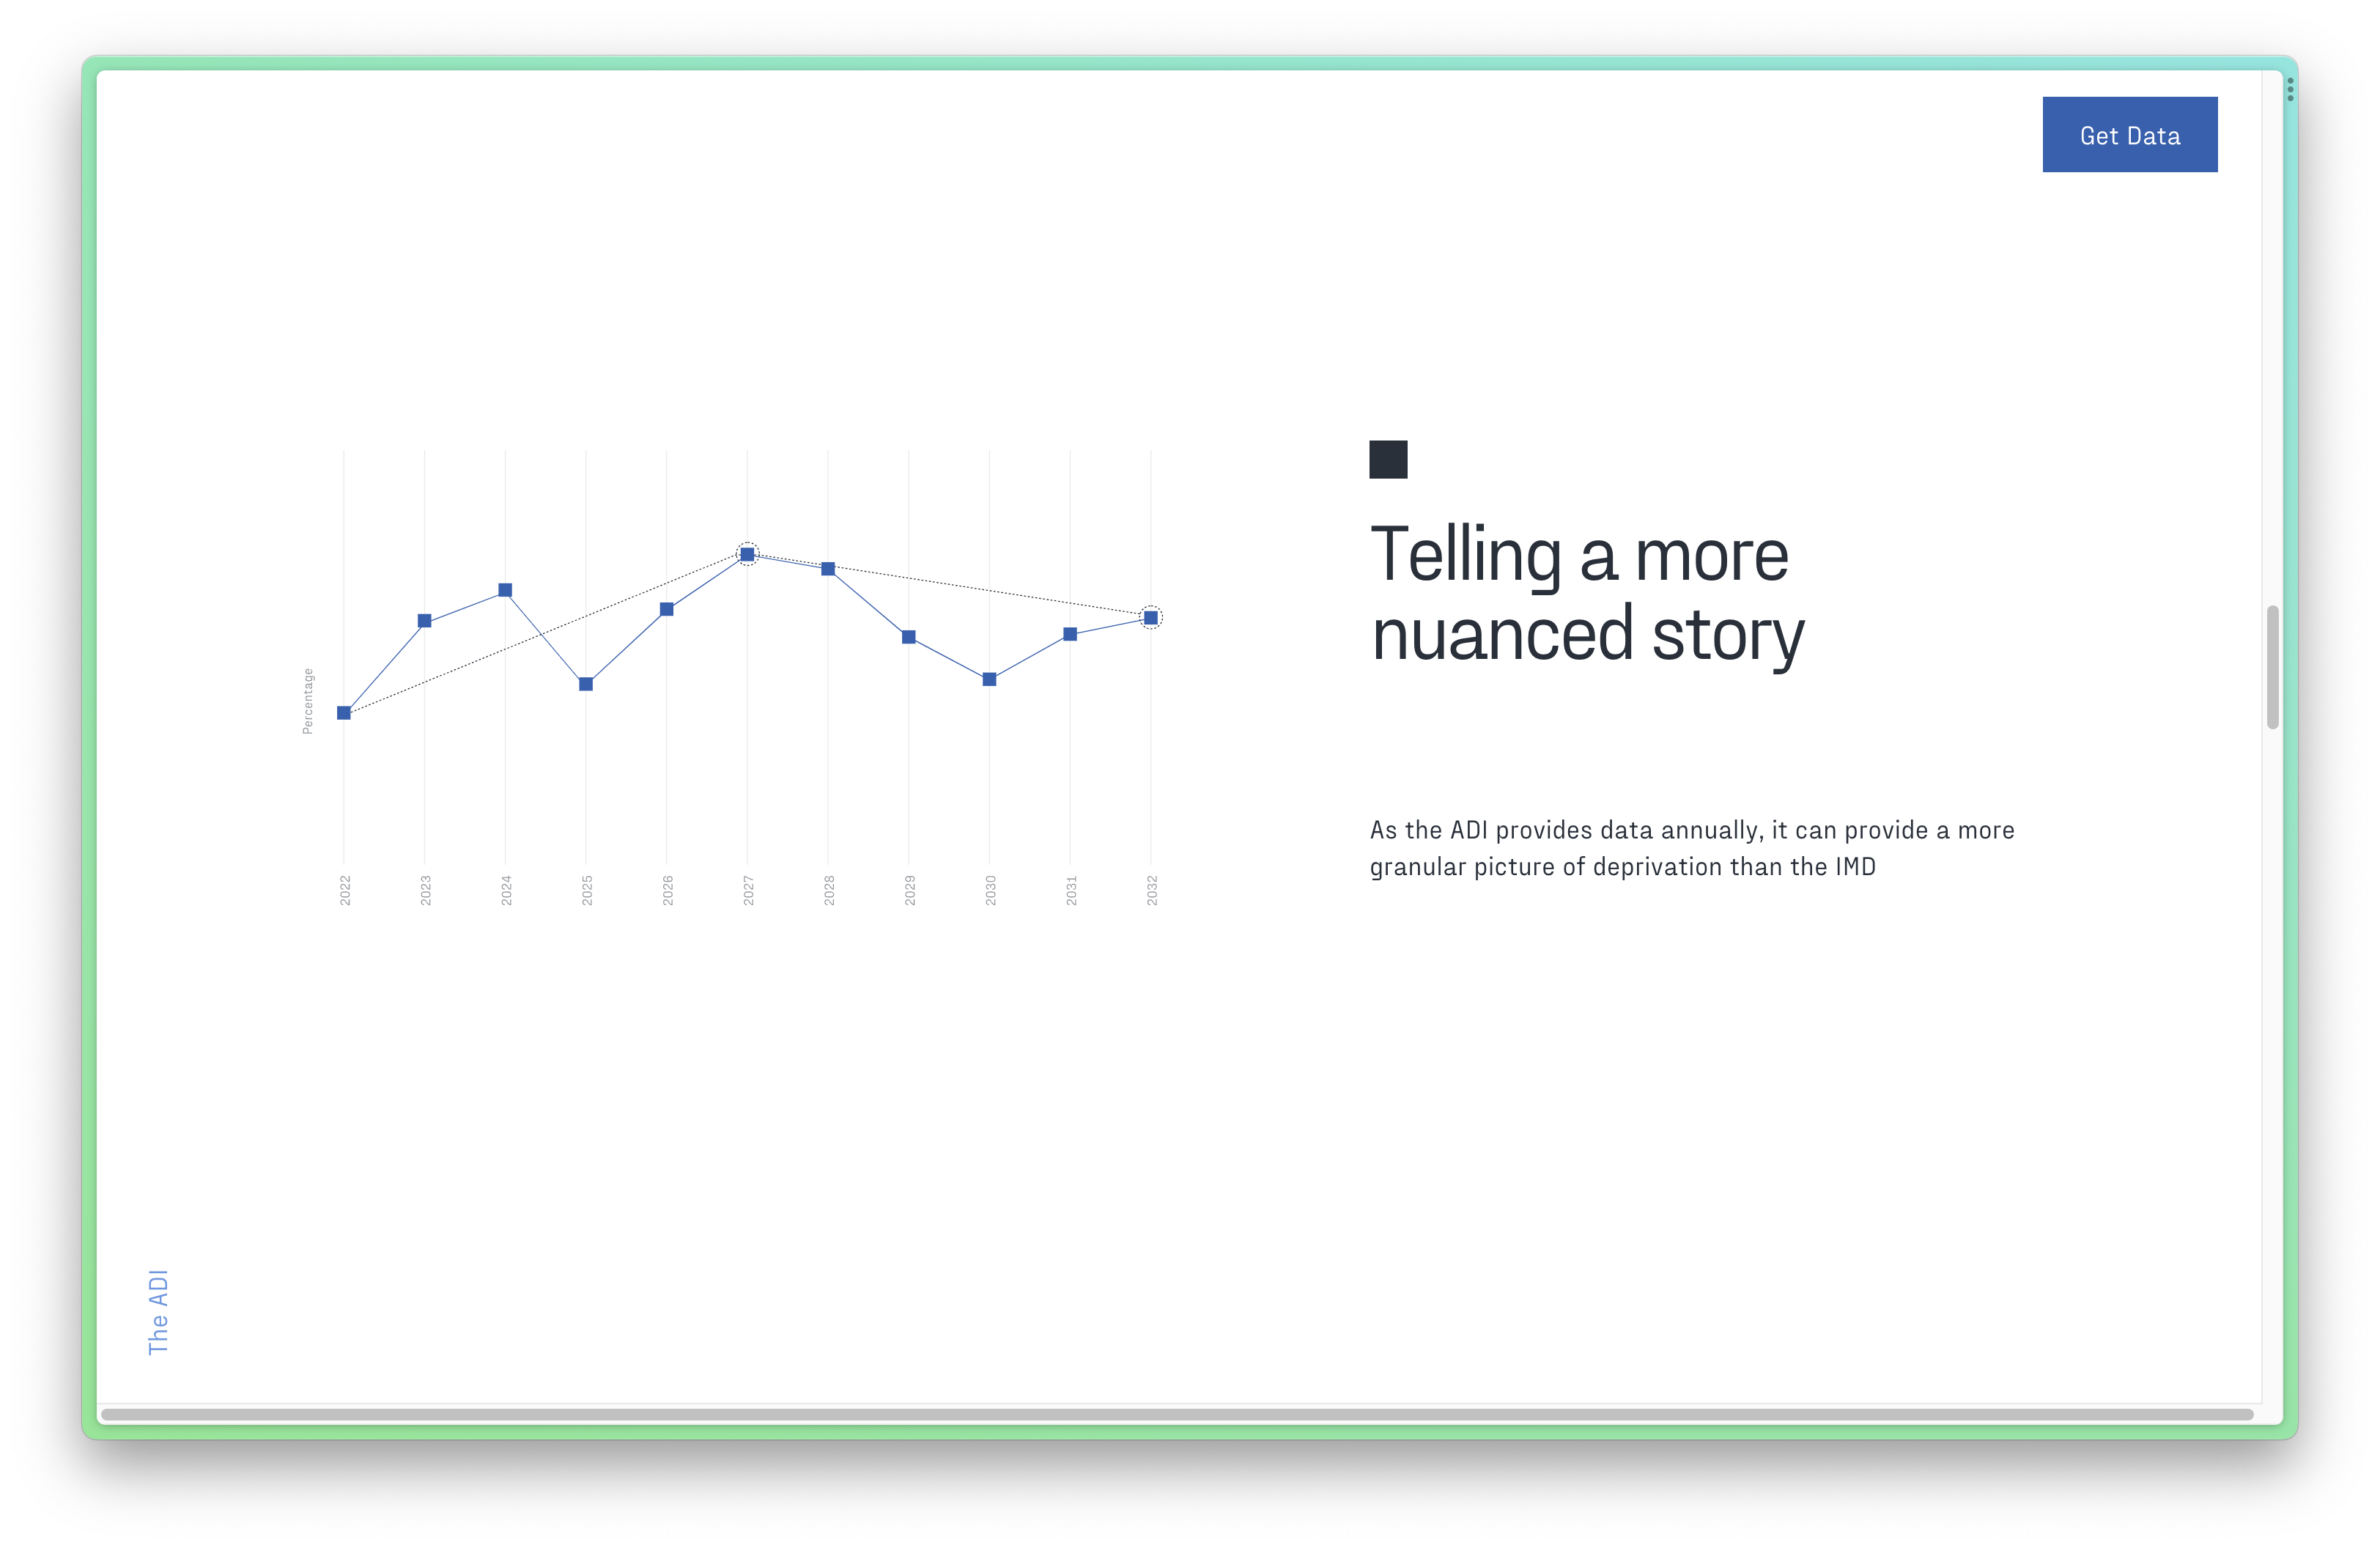
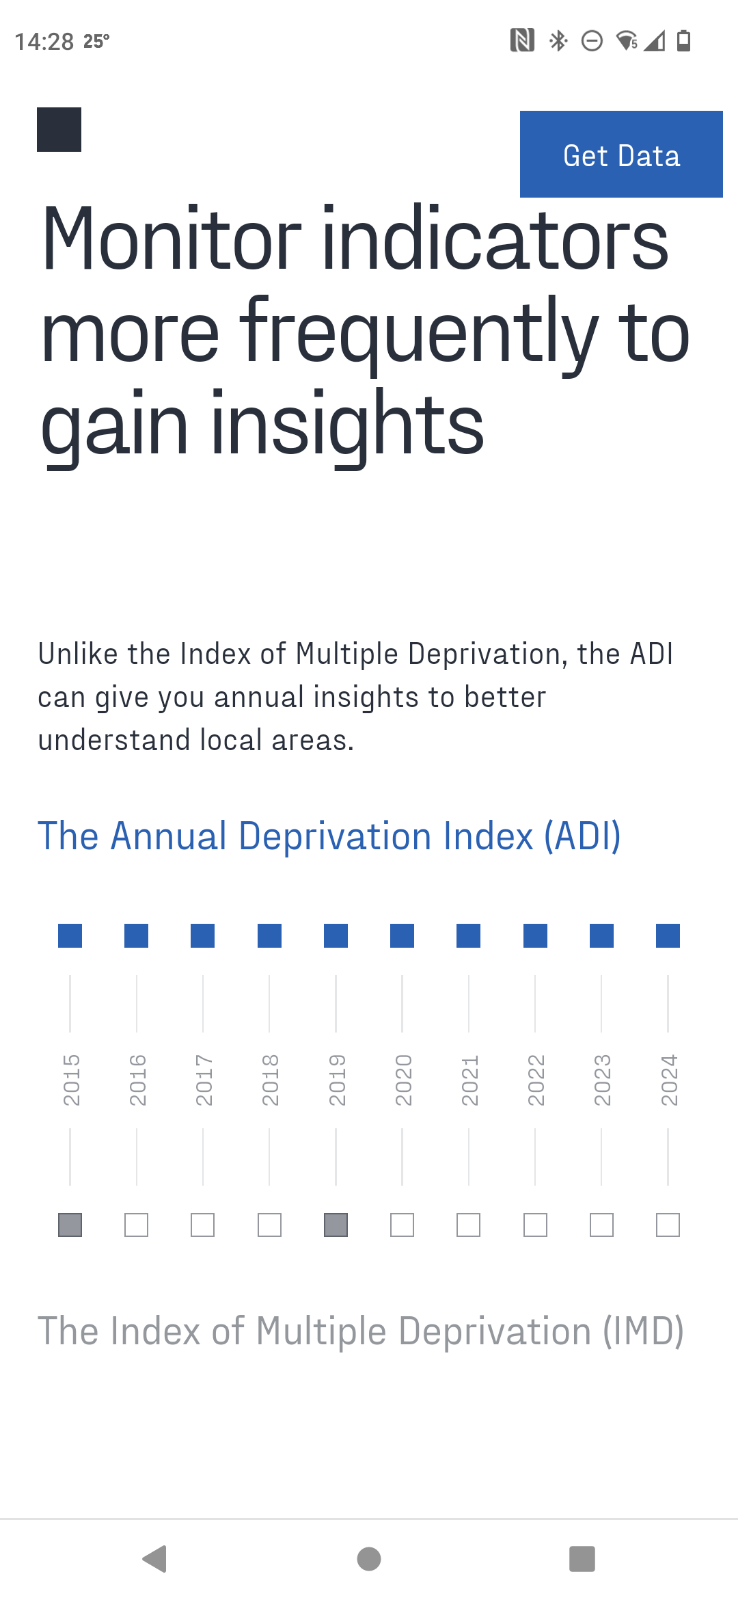
These indicators are the same as those used in the Index of Multiple Deprivation. However, unlike the Index of Multiple Deprivation, the ADI is updated annually, providing a more granular and up-to-date understanding of deprivation.
The data in the Index can be mapped to parliamentary constituencies, local authorities and neighbourhoods. Comparing different indicators across areas within a geographic space can reveal previously poorly understood patterns and inform decision-making.
Design Approach
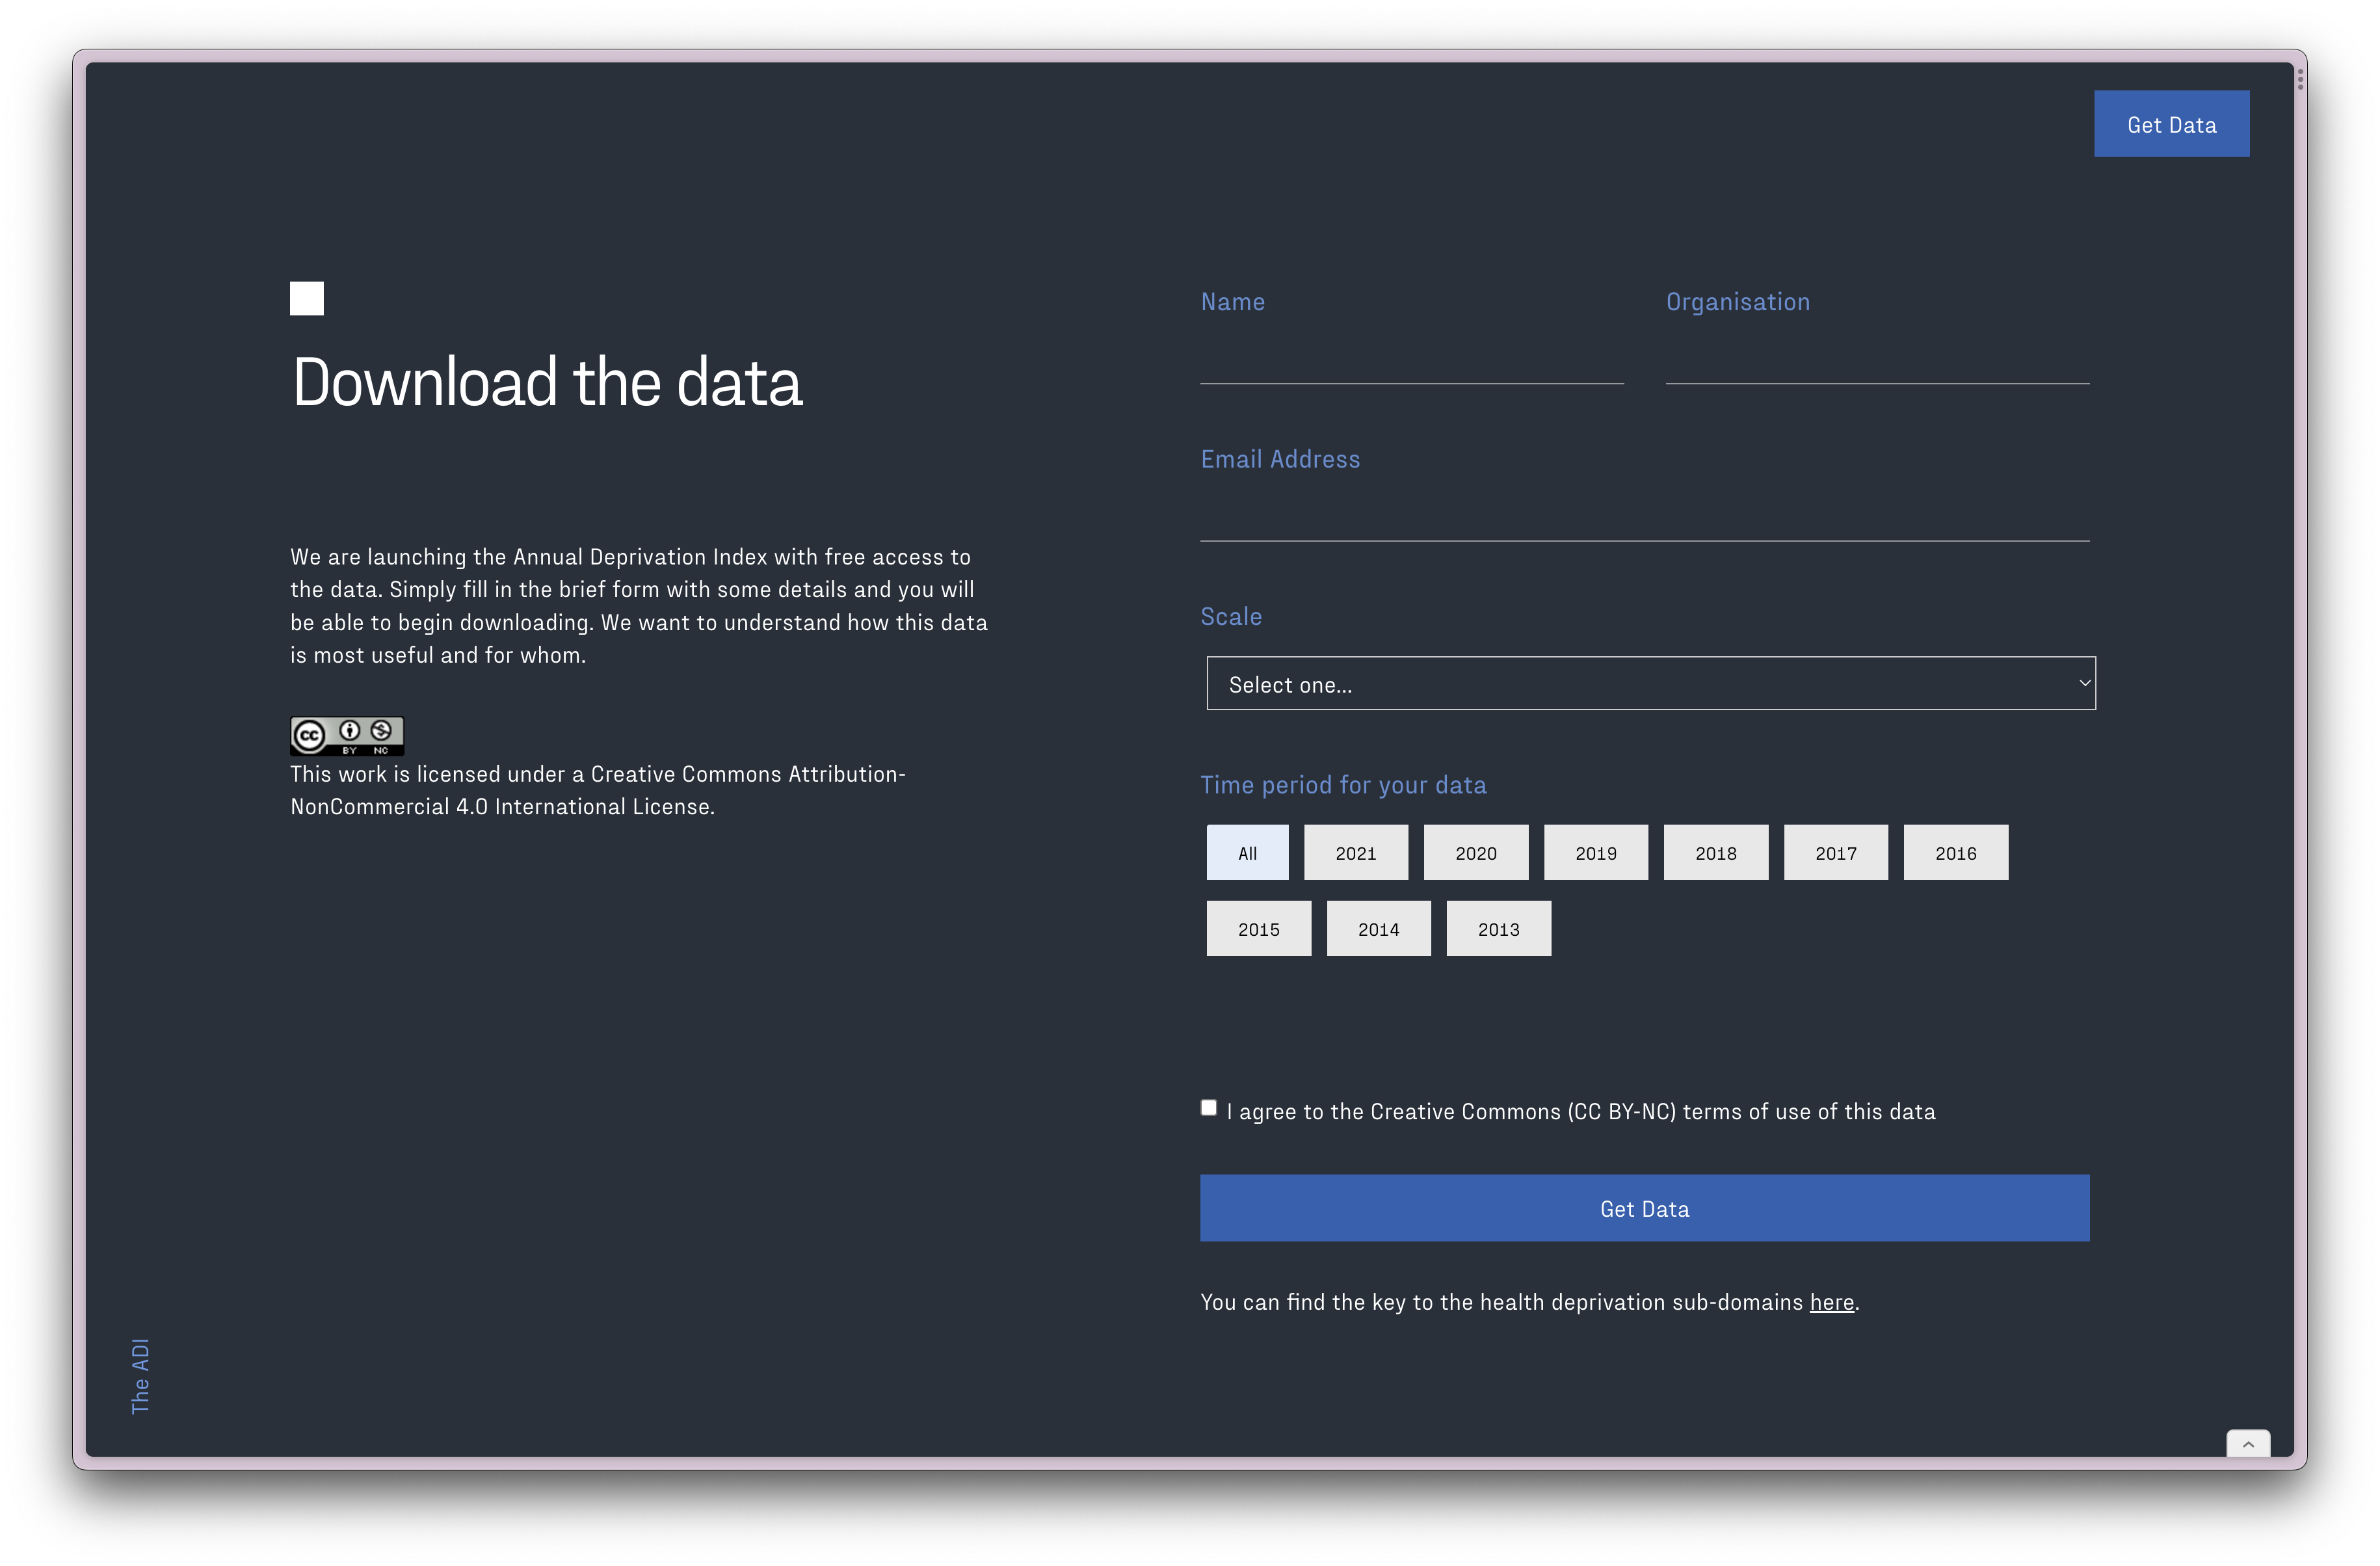
Our goal was to communicate the benefits of a more granular and frequent index of deprivation. The challenge here was working out how to keep people engaged on a single page site and convince them to download the data themselves.
We decided to keep the communication lean, breaking up the key messages into sections to showcase each of the core features. We harnessed the power of the GSAP plugin library to animate text, trigger transitions and provide a smooth scrolling experience.
Arby Hisenaj
Anna Tokareva
Lukas Kikuchi (Autonomy)
Webflow, Airtable